Course Curriculum

Introduction to Python
  • Getting Started with Python
  • Keywords and Identifiers
  • Statements and Comments
  • Python Variables
  • Python Data Types
  • Python Type Conversion
  • Python I/O and Import
  • Python Operators
  • Python Namespace
Python Flow Control
  • Python Conditional Statements
  • Python Loops
  • Python Break and Continue
  • Python Pass
  • Python goto
Python Functions
  • Introduction to Functions
  • Structure of a Function
  • Creating a Simple function in Python
  • Create a Function with Argruments in Python
  • Create a Function with default Arguments in Python
  • Create a Function that returns a value in Python
  • Create a Function that Returns Multiple Values in Python
  • Create a Function that takes a Variable Number of Arguments in Python (Arbitrary Arguments)
  • Recursive Functions
  • Anonymous Functions / Lambda Functions
  • Global, Local and Non-local
  • Python Global Keyword
  • Python Modules
  • Python Package
Python Files
  • Python Directory
  • Python Exception
  • Python Exception Handling
  • Python User-defined Exception
Python Object and class
  • Python OOP
  • Python Class
  • Python Inheritance
  • Multiple Inheritance
  • Operator Overloading
Python Date and Time
  • Python datetime Module
  • Python datetime.strftime()
  • Python datetime.strptime()
  • Current date & time
  • Get current time
  • Timestamp to datetime
  • Python time Module
  • Python time.sleep()
Numpy
  • What is NumPy
  • Why is NumPy Important
  • . How to get started with NumPy
  • NumPy Ndarray
  • Dimensions of an Array
  • Size of each array element
  • Data type of each array item
  • Shape and size of an array
  • Reshaping the array objects
  • Slicing in the Array
  • Finding the maximum, minimum, and sum of the array elements
  • Array Axis
  • Square root and standard deviation
  • NumPy Data Types
  • Data Type Objects (dtype)
  • Numpy Array Creation
  • Numpy.zeros
  • NumPy.ones
  • NumPy - Array Creation From Existing Data
  • Numpy.asarray
Pandas
  • What is pandas
  • Features of pandas
  • Importing and exporting
  • Data Structures of pandas
  • Series
  • Series -Retrieving data
  • DataFrame
  • Series- Functionality
  • DataFrame-Functionality
  • Reindexing
  • Iterating 12. 13. 14. 15. 16. 17. 18. 19.
  • Indexing and retrieving data
  • Checking for missing values
  • Groupby
  • Functionalities
  • Date functionalities
  • Descriptive stats
  • Aggregate
Advance Excel
  • Introduction to MS Excel
  • Advance Conditional Formatting
  • Table Format
Advanced Number Formatting
  • Custom Number Formatting
  • How to write long Number
  • How to write a number starting with zero (0)
  • Automatically added __ Qty/Pcs
  • Custom date format under number format.
Advanced Fill Formatting
Advanced Protection, Worksheet and Cell Protection
Special Function
  • Paste Special
  • Paste only Values
  • Only Formula
  • Column Width
  • Transpose
  • Comments etc
Advanced Filter Page Setup
  • Setting the Print area
  • Margin
  • Orientation
Lookup and Reference Formulas HlookUp
VlookUp
  • Exact & Approx Match
  • Dynamic Vlookup
  • Automatic Column Index Number
  • Vlookup with multiple Lookup value
  • Iferror
  • Double Vlookup
  • Lookup all data of same value
Relative Reference
Absolute Reference
Mixed Reference
Advanced Excel Topics Completed Date
Match Function
Index function
Match with Index Function
Row/Rows function
Column/Columns Functions
Compare List
Linking
  • Linking one cell with another
  • Grouping sheets
  • Grouping Columns and Rows
Advanced Data Validation
  • Restrict Invalid Data
  • Advanced Data Validation trick
  • Create Dependent Validation
  • Create Drop Down List
  • Make Sub-Headings in Drop Down List
  • Disguise Numbers as Text
  • Creating Dynamic Drop Down List (Auto Update)
  • Creating Dependent Drop Down List
  • Restrict more than 10 Nos(numbers only not text)
  • Restrict Number or Text
Name Ranges
  • Provide Name to any Ranges or Table
  • Freeze Both at a time
  • Sumif / Sumifs / Sumproduct Function
  • AverageA / Averageif / Averageifs Functions
  • CountA/Countif/Countifs/CountBlank Function
  • Flash Fill
Custom Fill
  • Concatenate
  • Text to Column
  • Separate First Name and Last Name
  • Extract username from email id
  • Convert to actual Date format
Few Important Function
  • Len / Trim
  • Upper / Lower / Proper
  • Min/Max Function
  • Left / Right / Mid
  • Large/Small Function
Logical & Math Formulas
  • If error Function
  • Round/Roundup/RoundDown Function
  • And / Or / Not Function
  • Is Function 5. Int Function
  • Rand / Rand Between function
  • Substitute Function
Charts
  • Creating Data Chart
  • Formatting Chart Elements
  • Explain Different types of Charts
  • Combo Chart
  • Actual Vs Target values
  • Dynamic chart with sumif function
  • Dynamic chart with form control
Pivot Table Introduction
  • Creating a Pivot Table
  • Formatting a Pivot Table
  • Grouping Data in an excel Pivot Table
  • Pivot Table Slicer
Pivot Charts Macro
  • Introduction to Basic Macro and VBA Editor
  • How to record a Macro
  • Macro implementation
  • Use of Macro with Advanced Filter and other Functions
Dashboard
  • What is Dashboard
  • Dashboard Designing in Excel
  • Utilization of Excel tables in Dashboard Designing
Power BI
Module 1 Introduction to Power BI
  • Introduction to Power BI – Need, Importance
  • Power BI – Advantages and Scalable Options
  • History – Power View, Power Query, Power Pivot
  • Power BI Data Source Library and DW Files
  • Cloud Collaboration and Usage Scope
  • Business Analyst Tools, MS Cloud Tools
  • Power BI Installation and Cloud Account
  • Power BI Cloud and Power BI Service
  • Power BI Architecture and Data Access
  • On Premise Data Access and Microsoft On Drive
  • Power BI Desktop – Installation, Usage
  • Sample Reports and Visualization Controls
  • Power BI Cloud Account Configuration
  • Understanding Desktop & Mobile Editions
  • Report Rendering Options and End User Access
  • Power View and Power Map. Power BI Licenses
  • Course Plan – Power BI Online Training
Module 2 Creating Power BI reports, Auto filters
  • Report Design with Legacy & .DAT Files
  • Report Design with Databse Tables
  • Understanding Power BI Report Designer
  • Report Canvas, Report Pages: Creation, Renames
  • Report Visuals, Fields and UI Options
  • Experimenting Visual Interactions, Advantages
  • Reports with Multiple Pages and Advantages
  • Pages with Multiple Visualizations. Data Access
  • PUBLISH Options and Report Verification in Cloud
  • “GET DATA” Options and Report Fields, Filters
  • Report View Options: Full, Fit Page, Width Scale
  • Report Design using Databases & Queries
  • Query Settings and Data Preloads
  • Navigation Options and Report Refresh
  • Stacked bar chart, Stacked column chart
  • Clustered bar chart, Clustered column chart
  • Adding Report Titles. Report Format Options
  • Focus Mode, Explore and Export Settings
Module 3 Report visualizations and properties
  • Power BI Design: Canvas, Visualizations and Fields
  • Import Data Options with Power BI Model, Advantages
  • Direct Query Options and Real-time (LIVE) Data Access
  • Data Fields and Filters with Visualizations
  • Visualization Filters, Page Filters, Report Filters
  • Conditional Filters and Clearing. Testing Sets
  • Creating Customized Tables with Power BI Editor
  • General Properties, Sizing, Dimensions, and Positions
  • Alternate Text and Tiles. Header (Column, Row) Properties
  • Grid Properties (Vertical, Horizontal) and Styles
  • Table Styles & Alternate Row Colors – Static, Dynamic
  • Sparse, Flashy Rows, Condensed Table Reports. Focus Mode
  • Totals Computations, Background. Borders Properties
Tableau Module 1 Connect to and Transform Data
  • Connect to data sources
  • Choose an appropriate data source
  • Choose between live connection or extract
  • Connect to extracts
  • Connect to spreadsheets
  • Connect to. hyper files (or .tde files)
  • Connect to relational databases
  • Pull data from relational databases by using custom SQL queries
  • Connect to a data source on Tableau Server
  • Replace the connected data source with another data source for an existing chart orsheet
  • Prepare data for analysis
  • Assess data quality (completeness, consistency, accuracy)
  • Perform cleaning operations
  • Organise data into folders
  • Use multiple data sources (establish relationships, create joins, union tables, blenddata) 16. 17. 18. 19. 20. 21. 22. 23.24. 25. 26. 27. 28.
  • Prepare data by using Data Interpreter, pivot, and split
  • Create extract filters
  • Perform data transformation in Tableau Prep
  • Choose which data transformation to perform based on a business scenario
  • Combine data by using unions
  • Combine data by using joins
  • Shape data by using aggregations
  • Perform filtering
  • Shape data by using pivots
  • Customise fields
  • Change default field properties (types, sorting, etc.)
  • Rename columns
  • Choose when to convert between discrete and continuous
  • Choose when to convert between dimension and measure
  • Create aliases
Module 2 Explore and Analyze Data
  • Create calculated fields
  • Write date calculations (DATEPARSE, DATENAME…
  • Write string functions
  • Write logical and Boolean expressions (If, case, nested, etc.)
  • Write number functions
  • Write type conversion functions
  • Write aggregate functions
  • Write FIXED LOD calculations
  • Create quick table calculations
  • Moving average
  • Percent of total
  • Running total
  • Difference and percent of difference
  • Percentile
  • Compound growth rate
  • Create custom table calculations
  • Year to date
  • Month to date
  • Year over year
  • Index
  • Ranking
  • First-last
  • Create and use filter
  • Apply filters to dimensions and measures
  • Configure filter settings including Top N, Bottom N, include, exclude, wildcard, and conditional
  • Add filters to context
  • Apply filters to multiple sheets and data sources
  • Create parameters to enable interactivity
  • In calculations With filters With reference lines
  • Structure the data Sets Bins Hierarchies Groups
  • Map data geographically
  • Create symbol maps
  • Create heat maps
  • Create density maps
  • Create choropleth maps.
  • Summarise, model, and customise data by using the Analytics feature Totals and subtotals Reference lines Reference bands Average lines Trend lines 37. Distribution bands 38. Forecast by using default settings
  • Customise a data forecasting model
  • Create a predictive model
Module 3 Create Content
  • Create charts
  • Create basic charts from scratch (bar, line, pie, highlight table,scatter plot, histogram, tree map, bubbles, data tables, Gantt, box plots, area, dual axis, combo)
  • Sort data (including custom sort)
  • Create dashboards and stories Combine sheets into a dashboard by using containers and layout options
  • Add objects
  • Create stories
  • Add interactivity to dashboards
  • Apply a filter to a view
  • Add filter, URL, and highlight actions
  • Swap sheets by using parameters or sheet selector 11. 12. 13. 14. 15. 17. 18. 19. 20.
  • Add navigation buttons
  • Implement user guiding sentences (click…, hover…, menu options)
  • Format dashboards
  • Apply colour, font, shapes, styling
  • Add custom shapes and colour palettes 16. Add annotations
  • Add tooltips
  • Apply padding
  • Remove gridlines, row-level and column-level bands, and shading
  • Apply responsive design for specific device layouts
Module 4 Publish and Manage Content on Tableau Server and Tableau Online
  • Publish Content
  • Publish a workbook
  • Publish a data source
  • Print content
  • Export content
  • Schedule data updates
  • Schedule data extract refreshes
SQL Module 1 Basics of SQL
  • RDBMS Concepts
  • Datatypes
  • Operators
  • Expressions
  • Create database
  • Drop database
  • Select Database
  • Create table
  • Drop table
  • Insert query
  • Select query
  • Where Clause
  • And ,or query
  • Update query
  • Delete Query
  • Like
  • Top
  • Order by
  • Group by
  • Distinct keyword
  • Sorting result

Duration: 6 Months

Overview

Data science is the dominion of analysis that deals with extensive volumes of data using modern tools and methodology to distinguish unseen patterns, procure meaningful information, and make business decisions, it uses composite machine learning algorithms to fabricate predictive models. Tech Booster is the best institute for learning Data Science.

This course comes under 100% Job Guaranteed package and hence anyone pursuing the course will be placed successfully in any of our tied up companies after completion of the training program.

Career Opportunities for Data Scientist:

Data Science is the most cutting-edge skill set given the increased usage of data analytics especially in India. The demand for data scientists is very high around the clock. However the role of a Data Scientist may change as per the requirement of a company.

Various Job Profiles after the completion of Data Science Course:

Data Architect and Administrators, Data Engineer, Data Analyst, Data Scientist, Machine learning Engineer, Business It Analyst, Marketing Analyst, and many more.
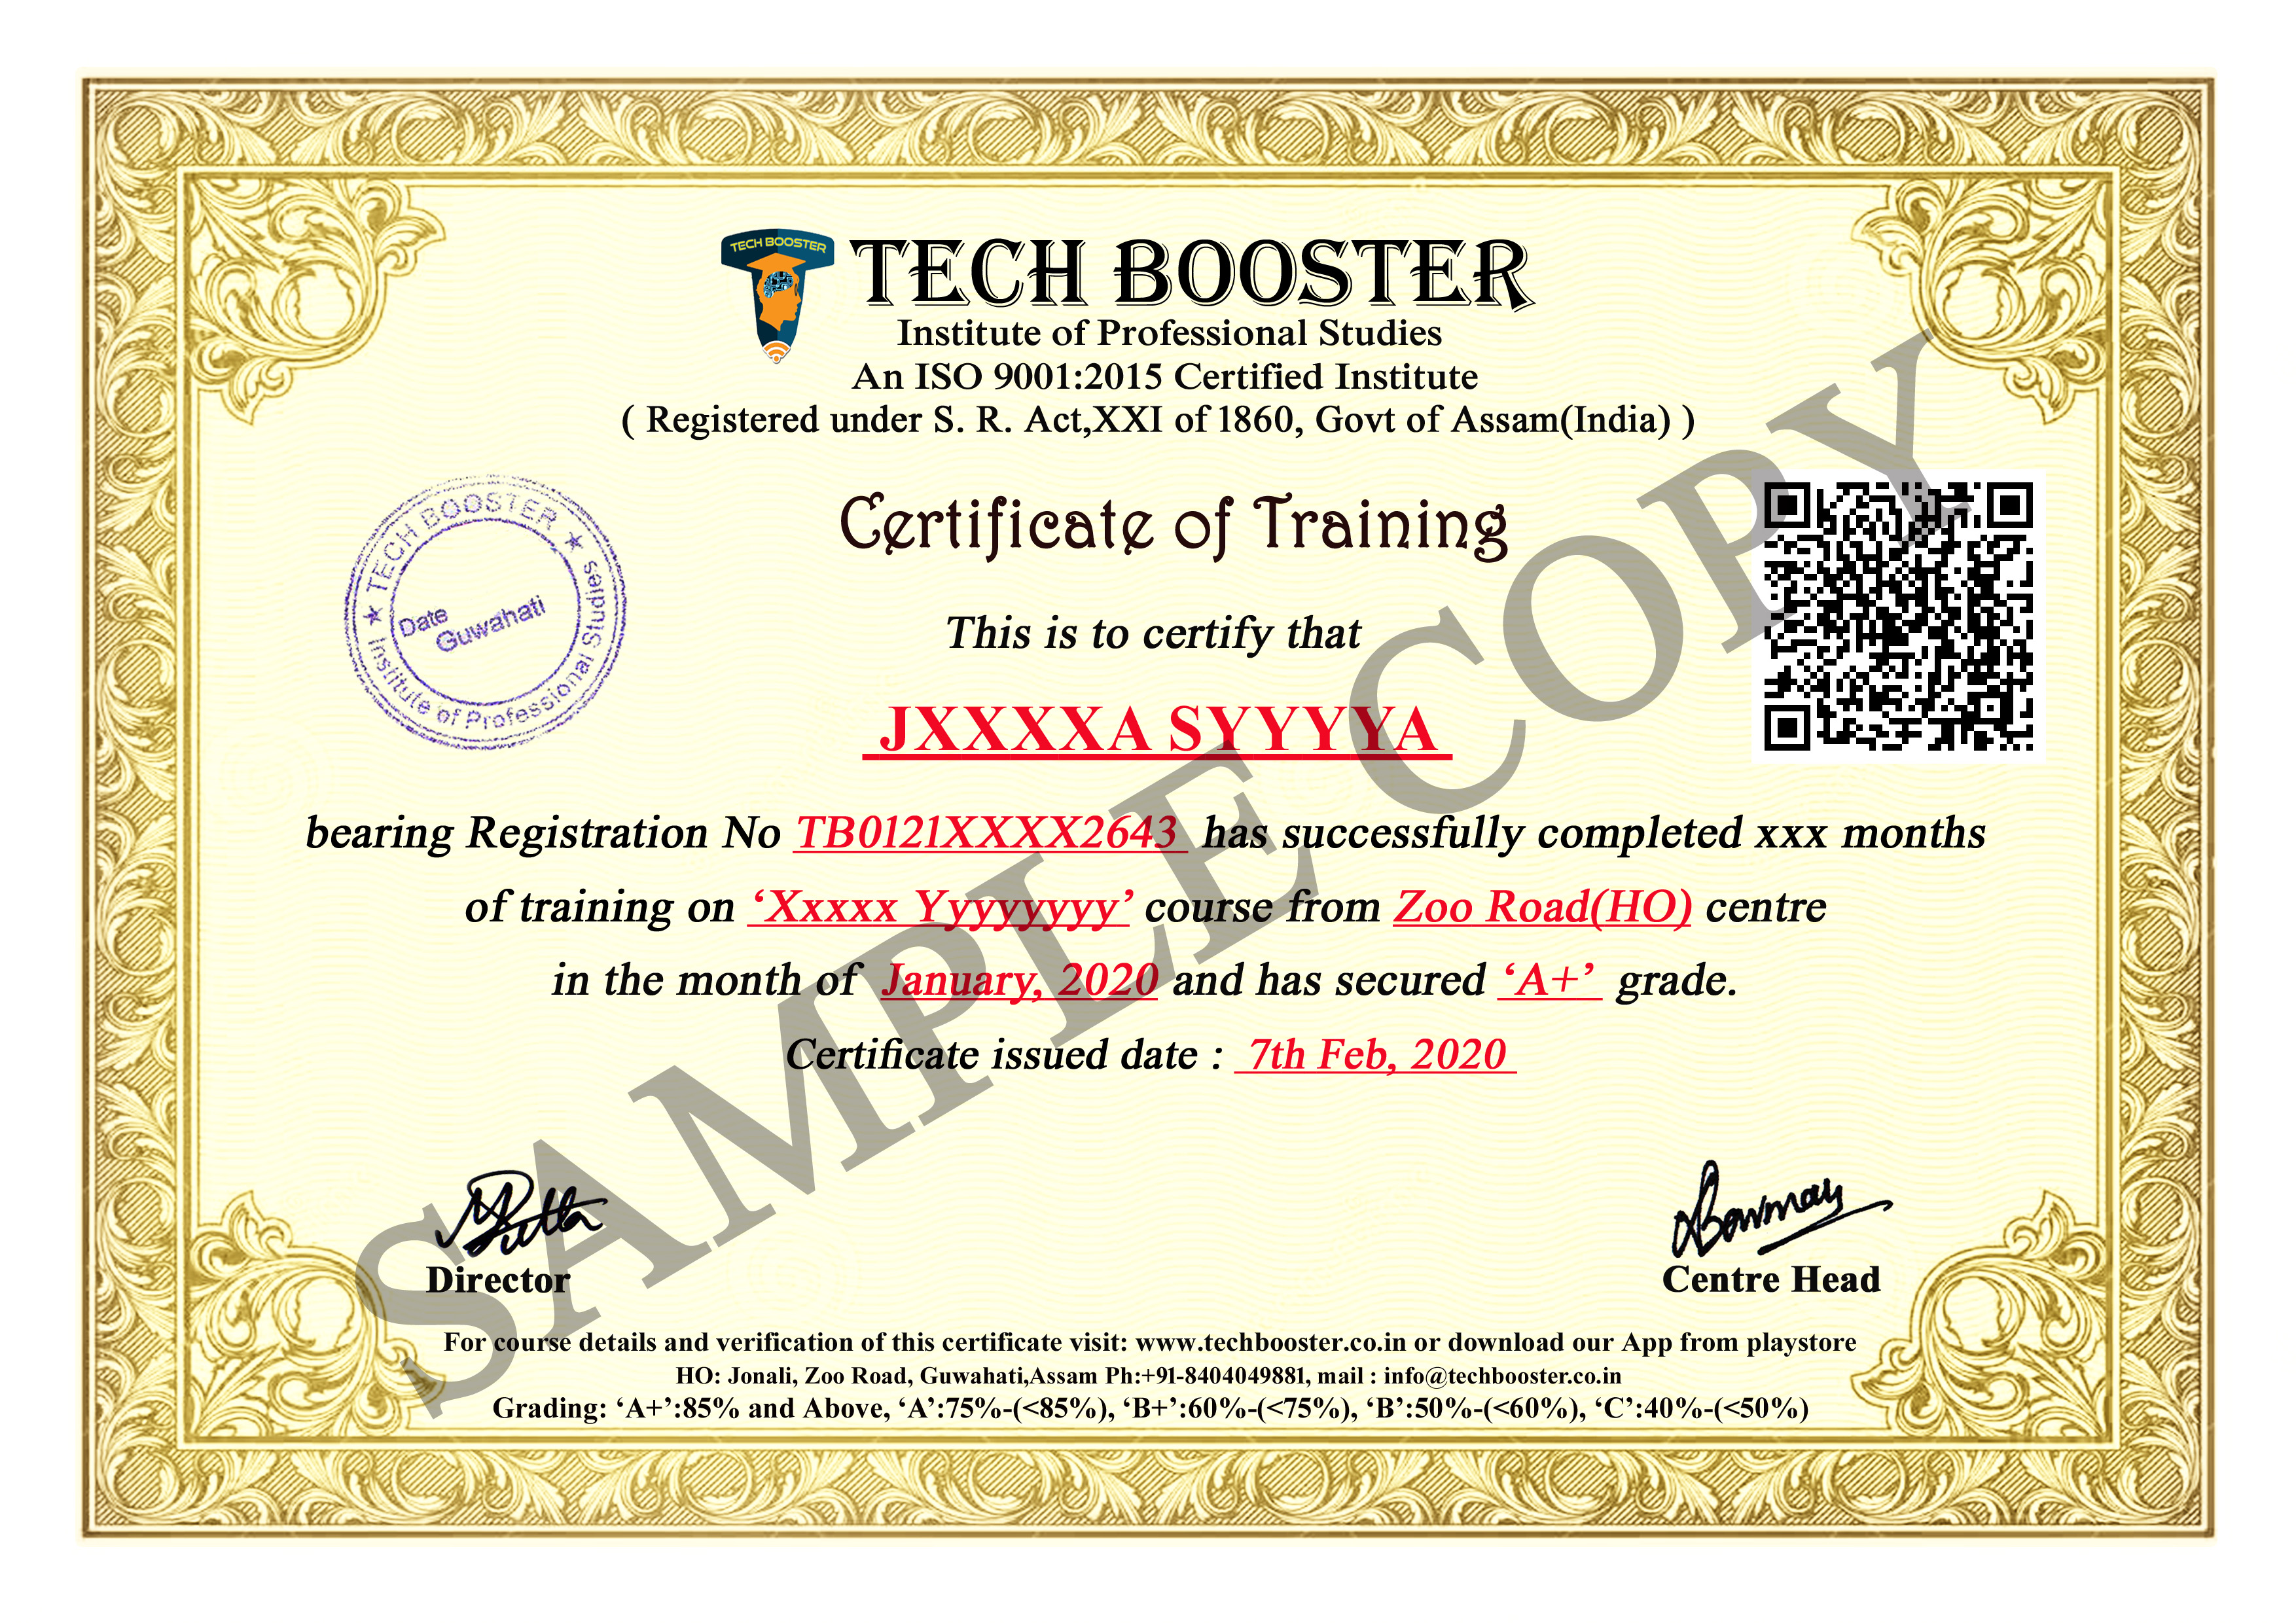
Certificate

Got any queries?

More Courses for You

Advanced
CCNA
(4.8 /5 Rating)

CCNA is one of the most respected Associate level Certification in the technological world. This program tests a candidate's knowledge and skills required to install, operate, and troubleshoot ...

  • 100+ Lessons
  • 650+ Students
Intermediate
CORE JAVA
(4.5 /5 Rating)

JAVA is the object oriented, similar to C++ high-level programming language and architecture neutral developed by Sun Microsystems.Java was originally called OAK. Object Oriented meaning the...

  • 80+ Lessons
  • 200+ Students
Advanced
CATIA V5
(4.7 /5 Rating)

CATIA is a multi-platform software suite for computer-aided design (CAD), computer-aided manufacturing (CAM), computer-aided engineering (CAE), PLM and 3D. This course is designed to introduce users..

  • 80 Lessons
  • 200+ Students